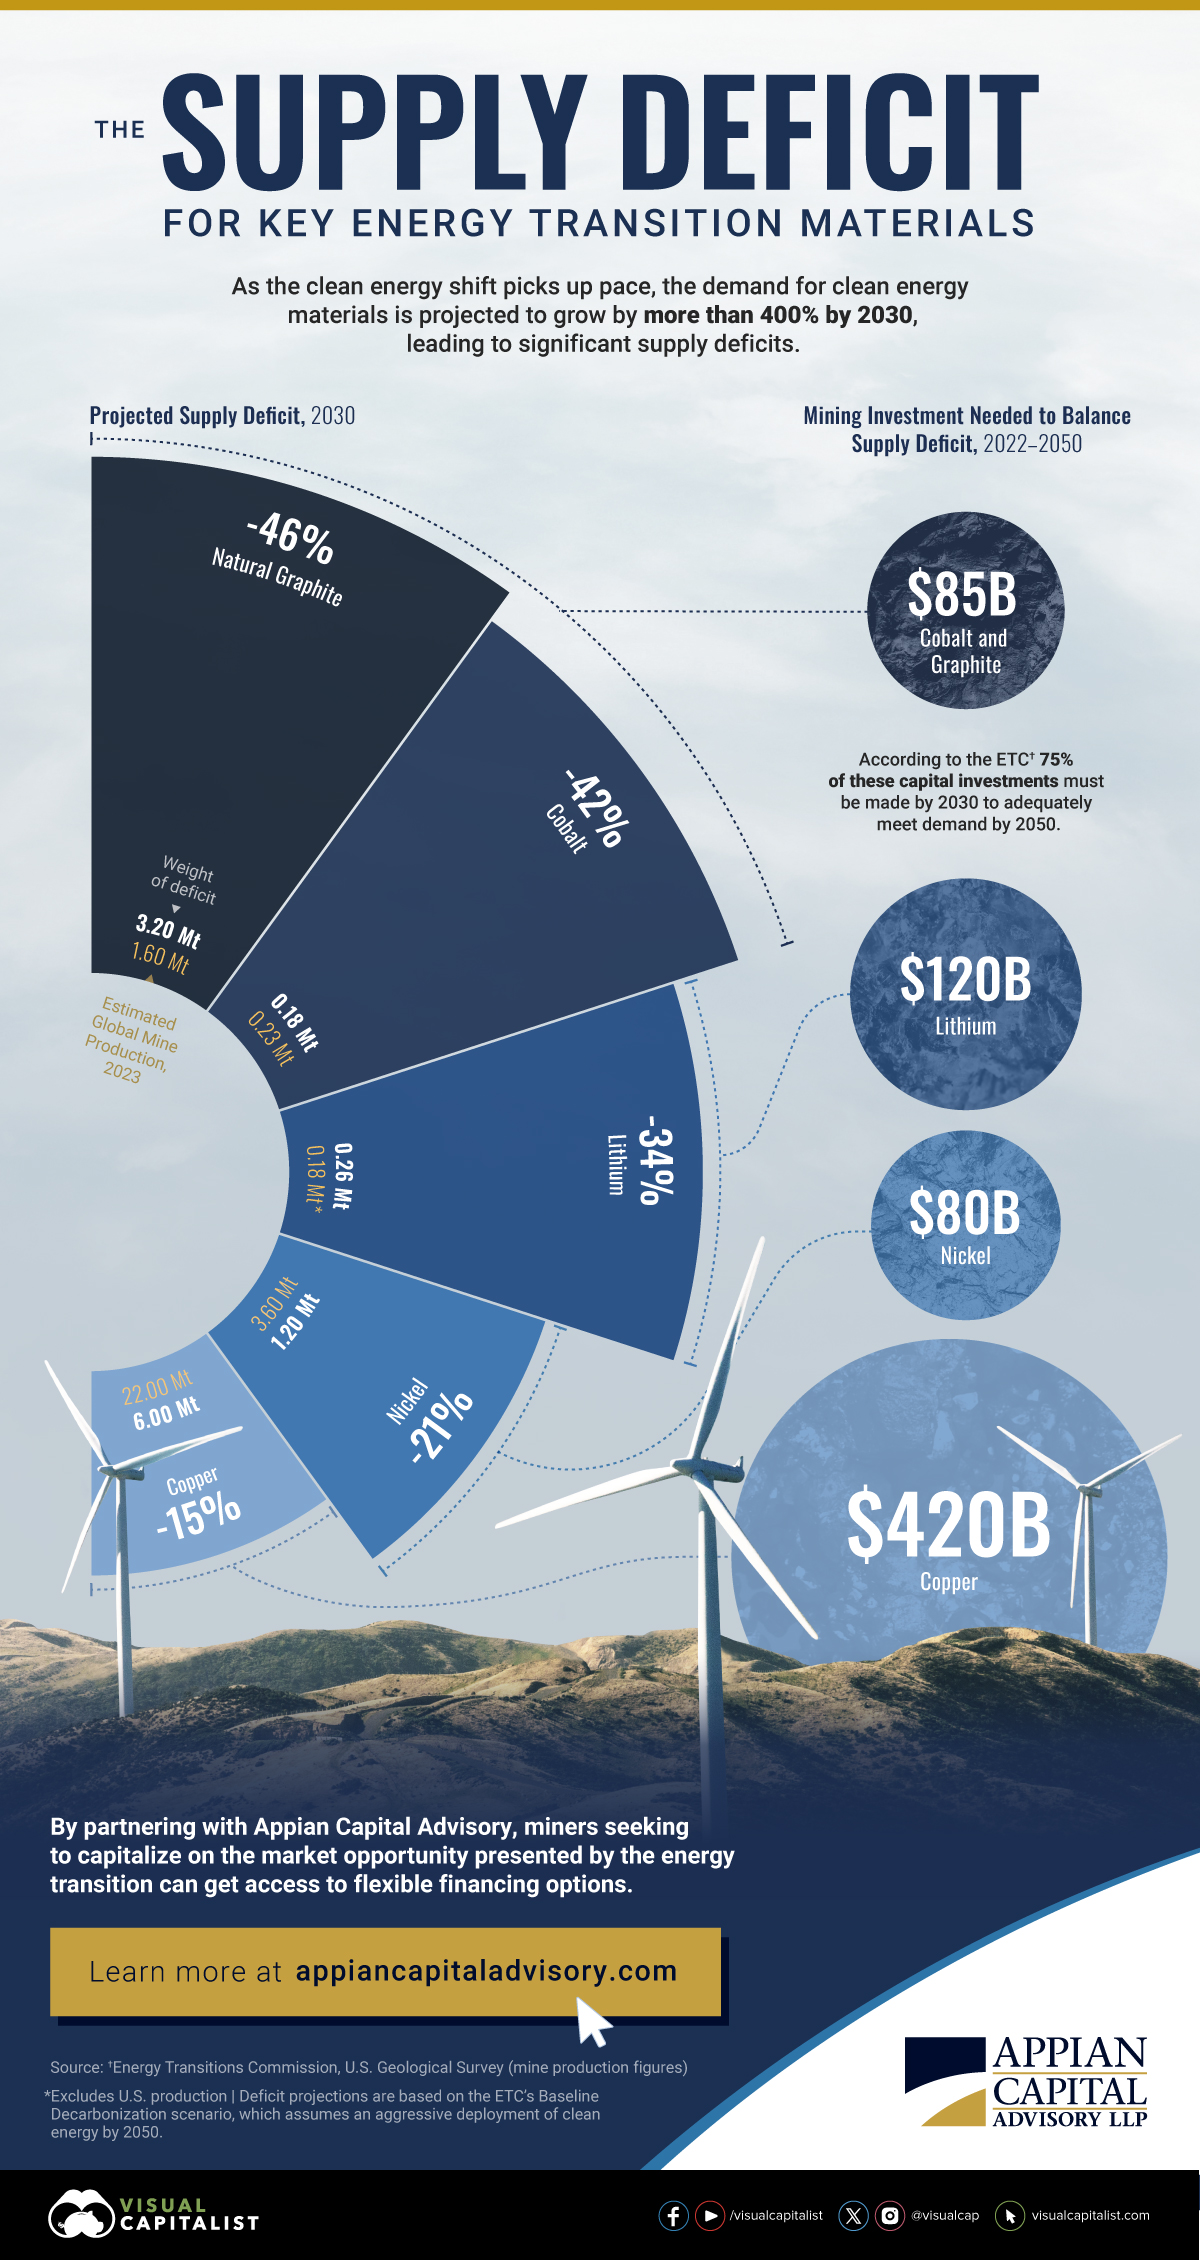
Projected Supply Deficits for Key Energy Transition Metals
The demand for clean energy metals will grow by more than 400% by 2030, according to the Energy Transitions Commission (ETC).
Supply, however, is not on track to keep up with this surging demand.
Visual Capitalist partnered with Appian Capital Advisory to visualize what these supply gaps may look like by 2030 and the mining investment needed to balance these deficits. The analysis uses data from the ETC and U.S. Geological Survey.
What Are the Critical Energy Transition Materials?
Building a clean energy future isn’t just about technology—it’s about materials. The transition to renewable energy will require a vast array of raw metals, such as:
- Natural graphite and cobalt: Critical for electric vehicles (EVs) and energy storage.
- Nickel: Critical for battery performance and an important component of wind turbines and green hydrogen technologies.
- Copper: Required for electrical wiring and expanding transmission infrastructure.
- Lithium: Central to batteries in EVs and energy storage.
Projected Supply Deficits
Here are the supply deficits expected by 2030 if the mining sector grows at its current trajectory, along with the investments needed to balance these deficits.
| Material | Projected Supply Deficit | Weight of Deficit (in metric tons) | Mining Investment Required To Balance Deficit 2022–2050 |
|---|---|---|---|
| Natural Graphite | -46% | 3.20 million | $85 billion (for graphite and cobalt combined) |
| Cobalt | -42% | 0.18 million | |
| Lithium | -34% | 0.26 million | $120 billion |
| Nickel | -21% | 1.20 million | $80 billion |
| Copper | -15% | 6.00 million | $420 billion |
Together, the above energy transition materials require more than $700 billion of investment through 2050 to balance their supply deficits.
75% of these capital investments should be made by 2030 in order to meet demand by 2050, according to the ETC.
Where Appian Capital Advisory Comes In
By partnering with Appian Capital Advisory, miners seeking to capitalize on the market opportunity presented by the energy transition can get access to flexible financing options.

Learn more at appiancapitaladvisory.com

-
 Mining7 days ago
Visualizing the Decline of Copper Usage in EVs
The total copper per vehicle is projected to decrease by 38 kg between 2015 and 2030.
-
 Gold3 weeks ago
Visualizing Gold Consumption vs. Domestic Supply
India’s consumption is 50 times higher than its domestic supply.
-
 Commodities1 month ago
Gold Prices by U.S. President (1989-2024)
Gold prices increased by 37% during Biden’s presidency, but which U.S. president saw the greatest gold price increase during their term?
-

 Markets1 month ago
A Gold Bar is Now Worth $1 Million, Thanks to Record-High Gold Prices
With gold prices hitting all-time highs in August, what is the value of a gold bar today?
-
 Agriculture2 months ago
Charted: $5 Trillion in Global Commodity Exports, by Sector
The energy sector accounts for 40% of the value of global commodity exports. And there’s a key product within it that dominates international trade.
-

 Central Banks2 months ago
The Top 10 Countries by Gold Reserves in 2024
The U.S. ranks first with more than double the reserves of second-place Germany.
The post Visualized: Projected Supply Deficits for Key Energy Transition Metals appeared first on Visual Capitalist.
var disqus_shortname = “visualcapitalist.disqus.com”;
var disqus_title = “Visualized: Projected Supply Deficits for Key Energy Transition Metals”;
var disqus_url = “https://www.visualcapitalist.com/sp/visualized-projected-supply-deficits-for-key-energy-transition-metals/”;
var disqus_identifier = “visualcapitalist.disqus.com-170713”;